We examined anonymized data from approximately 40,000 financial plans in search of insight into the current state of household personal finances across the US. Here are a few major highlights:
The average savings rate of 13.8% is considerably higher than estimated, and noticeably higher than previous years.
Even though savings rates are up, Americans are still struggling to reach their retirement goals and the majority (72%) are not on track.
Only 36.7% of households have all of the recommended types of insurance needed to protect them and their family based on their specific familial needs.
Households with dependents are not adequately covered with the proper life insurance. Nearly 50% do not have any, and many of those that do have a significant gap.
Estate planning is one area of financial planning that seems to be neglected, with only 23% having at least a basic will and 2.4% having a complete estate plan.
The average retirement shortfall is more than 10 years, meaning that Americans will either have to delay retirement or adjust their target lifestyle and retirement goals.
Savings & Income
The first major category we looked at covered savings and income. This included the different types of bank and savings accounts, savings rates, emergency fund, income, and net worth.
Savings Rate
How much is the average household saving vs. how much should they be saving?
13.8%
Current Savings Rate
On average, households are saving 13.8% of their monthly income.
22.4%
Recommended Savings Rate
The average recommended savings rate is 22.4% of monthly income.
9.1%
Savings Rate Gap
Households are still falling short on saving enough to reach their goals. The average savings rate gap is 9.1%.
The savings rate was larger than originally anticipated, but these numbers are consistent with the savings rate numbers published by Statista showing that the average personal saving rate was 13.6%.
Savings Accounts
What types of savings and investment accounts does the average household have?
81%
Retirement Account
The percentage of households that indicated they have at least one retirement savings account.
93%
Checking Account
The percentage of households that indicated they currently have at least one checking account.
81%
Savings Account
The percentage of households that indicated they currently have at least one savings account.
26%
Health Savings Account
The percentage of households that indicated they currently have a Health Savings Account.
Emergency Funds
Are households adequately prepared to face financial emergencies that arise?
65%
Dedicated Emergency Savings
65% of households indicated that they currently have a dedicated emergency fund of any size.
2.3
Emergency Fund Coverage
The median household has enough ’emergency’ savings to cover 2.3 months worth of expenses. The recommended amount is anywhere between 3 to 6 months.
Emergency Fund Coverage by Age
The above chart breaks down the median emergency fund coverage amount in months by age ranges.
Net Worth
How much is the average household worth and which age group has the highest net worth?
$446K
Average Net Worth
The average net worth of households.
$146K
Median Net Worth
The median net worth of households.
Average Net Worth by Age
The above chart indicates the average net worth by age ranges.
Debts & Liabilities
The second financial category we looked at covered debt and liabilities. This includes total debts, credit card debts, student loans, and overall debt-to-income.
Credit Card Debts
How many households have credit cards and what impact do they have?
97.6%
Credit Card Ownership
The percentage of households that have one or more active credit cards.
$10.3K
Credit Card Debt
The average total amount of credit card balance carried monthly.
3.8%
Minimum Payments
The percentage of households that do not make more than the minimum payments each month.
Student Loans
How is student debt impacting the financial future of Americans?
28.9%
Active Student Debt
The percentage of households that have active student debt obligations.
$50.4K
Total Student Debt
The average amount of current total student debt per household.
6.1%
Student Debt-to-Income
The percentage of income that goes towards paying down monthly student loan obligations.
Debt-to-Income
What is the Nationwide average debt-to-income across households?
21.2%
Average DTI
The average DTI is 21.2%. This means that 21.2% of monthly income is used to make payments on debt.
$2K+
Average Monthly Debt Payments
The total monthly debt payments averages $2,055. This means that households are obligated to pay $2,055 every month towards debt alone.
Average Monthly Debt Payments by Age
The above chart indicates the average monthly debt payments for each age range.
Insurance & Risk
The third financial category we looked at covered insurance and risk management. Specifically, we took a look at total insurance coverage, term life coverage for those with dependents, and estate planning requirements.
Total Insurance Coverage
Are American households properly insured? If so, what types of insurance do they have in place?
63.3%
Recommended Insurance
The percentage of households that do NOT have all of the recommended insurance, meaning only 36.7% of households are properly insured.
87.8%
Health Insurance
The percentage of Americans that have some form of health insurance.
56.6%
Life Insurance
The percentage of households that have some form of life insurance coverage.
Life Insurance Coverage
Are individuals properly insured when it comes to having the right amount of life insurance?
64.7%
Life Insurance Policy
The percentage of individuals with dependents, including a spouse, that have life insurance.
$467K
Total Coverage Amount
The average total life insurance coverage amount is $467K.
59%
Coverage Gap
Of the individuals that have life insurance coverage, 59% of them do not have enough coverage.
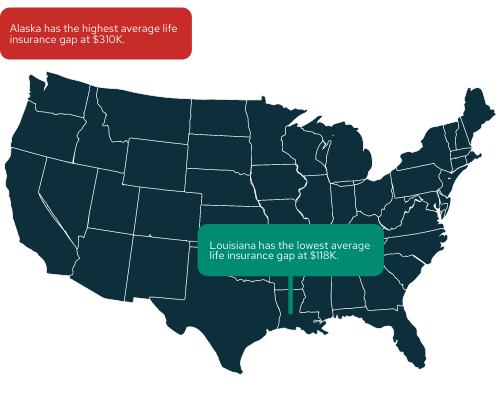
$174K
Gap Amount
The average life insurance coverage gap is $174K.
Estate Planning
Are households adequately planning for their estate and making end of life arrangements?
23%
Basic Will
The percentage of households that have at least a basic will as part of their estate plan.
The percentage of households with dependents that have a guardianship nomination in place.
Retirement Outlook
The fourth financial category we covered was retirement outlook. This included projected retirement income, desired retirement outcomes, and retirement savings.
Retirement Goals
What are the average retirement goals for households across the nation?
62
Desired Retirement Age
The average desired retirement age for Americans is 62.
79.9%
Desired Retirement Income
The average desired retirement income represents 79.9% of current income, meaning that the average American wants to retire with about the same lifestyle as they currently have.
Desired Retirement Lifestyle (% of Americans)
Retirement Trajectory
What does the retirement trajectory look like for the average household?
72.6
Realistic Retirement Age
Based on current financial situations, the average realistic retirement age is 72.6 compared to the average desired retirement age of 62.
64.7
Realistic Retirement Age (with changes)
If prescribed changes were made, the average realistic retirement age would be 64.7 which is only three years later than the desired retirement age of 62.
68%
Realistic Retirement Income
The realistic retirement income replacement, if no action is taken, is 68%. This means that the average American will live a more minimal lifestyle in retirement than their current lifestyle.
Total Retirement Savings
How much will the average household have in total savings at retirement?
28%
On Track
On average, only 28% of households are on track to reach their retirement goals. The majority of households (72%) are not on track.
10.7
Shortfall Years
The average number of retirement years that Americans will not have enough savings to cover their cost of living.
Average Current Retirement Savings (in USD) by Age
The above chart shows the average amount of current retirement savings for each age group.
Best vs. Worst
Last but not least, we looked at the top and bottom performing states across different financial metrics to compare which locations are performing well in certain areas and which ones are not.
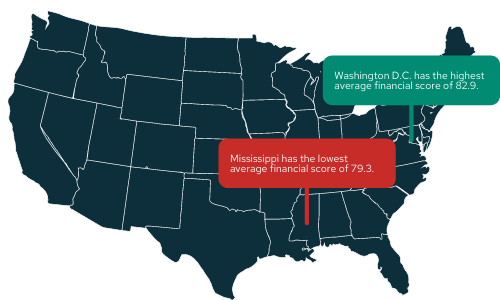
Overall Financial Wellness
Which states have the highest average financial score and which have the lowest?
*Financial scores are graded using Savology's proprietary financial report card, where personal finances are measured on a 100 point scale across 10+ categories.
Highest Score by State
State
Score
Rank
DC
82.9
1
WI
82.8
2
SD
82.5
3
MA
82.4
4
UT
82.4
5
ND
82.4
6
MN
82.3
7
CT
82.2
8
IA
82.2
9
NE
82.2
10
Lowest Score by State
State
Score
Rank
MS
79.3
51
OK
79.5
50
WV
79.5
49
WY
79.5
48
LA
80.0
47
AL
80.1
46
AR
80.2
45
ME
80.2
44
FL
80.5
43
RI
80.5
42
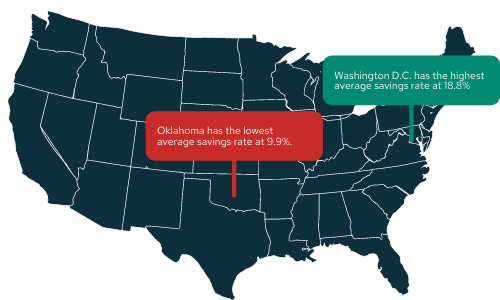
Savings Rate
Which States have the highest average savings rate and which have the lowest?
Highest Savings Rate by State
State
Savings Rate
Rank
DC
18.8%
1
WA
15.6%
2
AK
15.5%
3
UT
15.5%
4
WI
15.3%
5
CA
15.0%
6
IL
14.9%
7
VT
14.8%
8
MA
14.7%
9
PA
14.6%
10
Lowest Savings Rate by State
State
Savings Rate
Rank
OK
9.9%
51
WV
10.2%
50
AR
10.5%
49
MS
11.2%
48
TN
12.2%
47
AL
12.2%
46
SD
12.2%
45
LA
12.3%
44
DE
12.3%
43
SC
12.4%
42
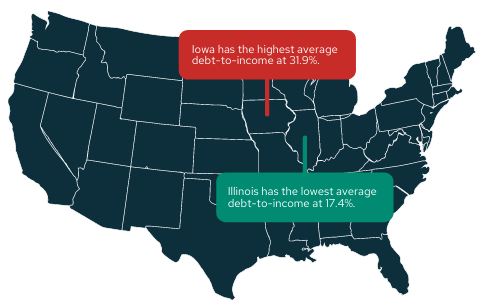
Debt-to-Income
Which states have the lowest average debt-to-income and which have the highest?
Lowest DTI by State
State
DTI %
Rank
IL
17.4%
1
DC
18.1%
2
NY
18.5%
3
WI
18.6%
4
MI
18.6%
5
SD
18.7%
6
AZ
19.3%
7
AR
19.5%
8
CT
19.7%
9
UT
19.8%
10
Highest DTI by State
State
DTI %
Rank
IA
31.9%
51
ME
28.7%
50
WY
24.9%
49
NC
24.6%
48
KY
24.4%
47
WV
24.2%
46
ID
24.1%
45
RI
24.0%
44
SC
23.7%
43
AK
23.4%
42
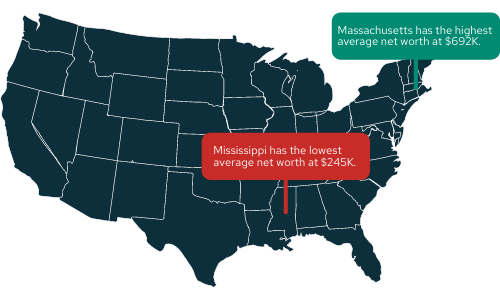
Net Worth
Which states have the highest average net worth and which have the lowest?
Highest Net Worth by State
State
Net Worth
Rank
MA
$691, 976
1
NJ
$625, 873
2
CO
$571, 455
3
CA
$549, 449
4
DE
$539, 447
5
MT
$529, 601
6
SD
$519, 629
7
WA
$509, 914
8
VA
$505, 188
9
NC
$500, 437
10
Lowest Net Worth by State
State
Net Worth
Rank
MS
$245, 049
51
WV
$273, 322
50
AR
$282, 125
49
ME
$291, 498
48
OK
$297, 256
47
WY
$297, 821
46
HI
$320, 511
45
RI
$335, 110
44
DC
$337, 164
43
KS
$338, 461
42
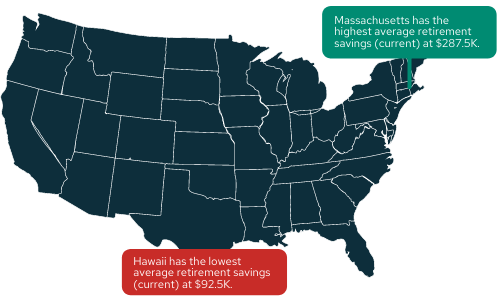
Retirement Savings
Which states have the highest average retirement savings and which have the lowest?
*Retirement savings numbers are based on the current amount saved, in today's dollars.
Highest Amount by State
State
Retirement Savings
Rank
MA
$287, 518
1
NJ
$274, 267
2
IL
$245, 575
3
DE
$244, 541
4
CT
$231, 370
5
WI
$224, 819
6
NC
$222, 737
7
VA
$222, 252
8
MD
$217, 601
9
CO
$213, 588
10
Lowest Amount by State
State
Retirement Savings
Rank
HI
$92, 513
51
MS
$96, 878
50
UT
$101, 052
49
OK
$114, 453
48
DC
$118, 968
47
WY
$121, 452
46
ME
$125, 622
45
ID
$129, 355
44
VT
$135, 359
43
AR
$137, 720
42
Download the report below
Download the Full Report
The full report includes more in-depth breakdowns and analyses that compare data across states, and age ranges.
About the Report
Savology is an online financial planning platform providing households across the United States with affordable, effective, and personalized financial planning.
Savology’s The State of Personal Finance 2020 examined anonymized data from approximately 40,000 households to analyze the current state of household personal finances across the United States. To preserve data integrity, outliers were removed from all financial categories.
The report depicts an overview of how households are currently managing and handling all areas of their financial lives which includes four major financial planning categories: Savings and income; Debt and liabilities; Insurance and risk; and Retirement outlook.
40K
Sample Size
We examined anonymized data from approximately 40,000 households.
20-70
Age Range
Plan data included individuals ranging from 20 to 70 years of age.
51
Number of States
Plan data represents all 50 states, plus Washington D.C.
$96K
Median Household Income
The median household income of this sample is $96K.
Using the Data
Savology is an online financial planning service with the goal of making financial planning more affordable and effective than ever before.
This report, and the figures provided, was intended to be shared, distributed, and disseminated. We encourage you to explore, share, and reference the findings of our report, giving attribution to “Savology” or “Savology.com” and link to this page as the official source.